


Mass spectrometry has long been regarded as the gold standard for reading out the glycan structures that decorate proteins, lipids, and other biomolecules. Yet the discipline of Glycomics has repeatedly collided with a practical bottleneck: the datasets produced by liquid chromatography or capillary electrophoresis coupled to MS are so dense, so large, and so structurally ambiguous that turning raw spectra into confident glycan assignments has remained a heavily manual craft. A newly released open-source program, GlycoGenius, takes direct aim at that bottleneck by wrapping the entire analytical pipeline—from peak detection through structural annotation and manuscript-ready output—into a single, intuitive environment.
The Data Problem That Slowed Glycomics Down
Unlike peptides, glycans do not follow a simple linear code. A single mass can correspond to many isobaric monosaccharide combinations, branch points multiply the number of candidate structures, and the variety of glycosidic linkages adds yet another layer of ambiguity. As a result, a routine LC-MS or CE-MS run can generate anywhere from a few thousand to tens of millions of spectra, frequently spanning tens to hundreds of gigabytes of raw signal. Interpreting these outputs by hand is cumbersome, slow, and in practice often infeasible for the multi-sample studies that modern glycobiology demands.
The existing software landscape only partially relieved this burden. Researchers could already generate peak lists with general metabolomics tools and cross-reference them against spectral libraries, but the workflow typically required rigorous manual verification at every step and constant file-format juggling between modules that were never designed to interoperate. The contrast with proteomics is stark: automated, low-touch pipelines for peptide identification have existed for more than fifteen years, while glycans lagged far behind. That gap is precisely what the developers of GlycoGenius set out to close.
An End-to-End Pipeline in One Program
At its core, GlycoGenius is built around a streamlined workflow that automatically assembles the search space of possible glycans, traces extracted ion chromatograms and electropherogram envelopes, scores and quantifies each peak, filters the results, and annotates fragment spectra. It supports a broad chemical vocabulary: any reducing-end tag, monosaccharide modifications, phosphorylation, and sulfation can all be specified, and the engine can resolve multiple co-eluting peaks within a single chromatogram so that isobaric compounds are quantified separately rather than collapsed together.
Visualization is treated as a first-class feature rather than an afterthought. From raw spectra and chromatograms to custom-traced extracted ion currents, isotopic envelopes of identified glycans, and SNFG-format structural cartoons produced by the built-in Draw module, the program keeps every stage of the analysis inside one unified interface. It also emits comprehensive reports and high-resolution figures, so that a researcher—regardless of prior expertise—can move from raw data to a manuscript-ready result without leaving the application. The scope covers Glycan Profiling across N-glycans, O-glycans, glycosaminoglycans, and even glycopeptides, which makes the tool relevant to laboratories working on very different glycan classes.
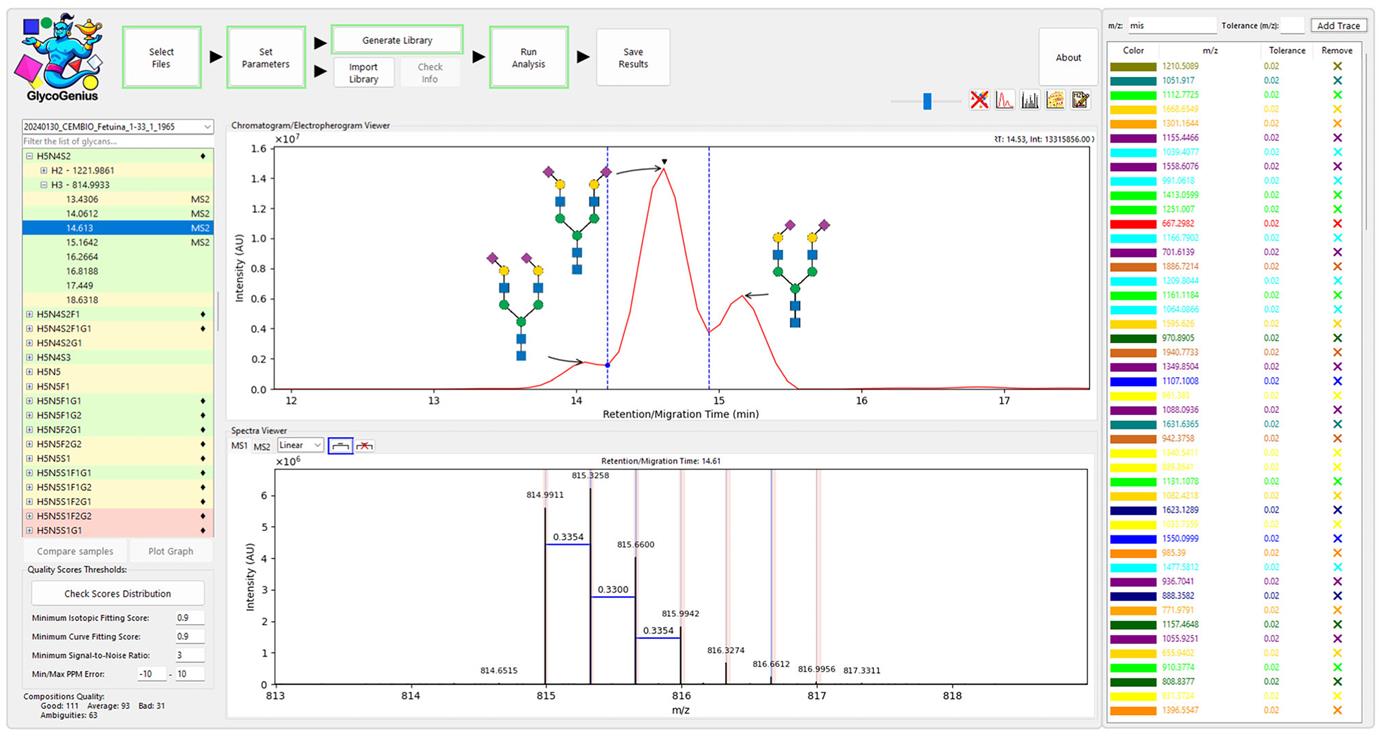
Fig. 1 GlycoGenius presents an integrated graphical interface that guides users through glycan identification, peak tracing, and spectrum inspection within a single window. (Loponte, et al. 2025)
Tested on Three Demanding Datasets
To demonstrate versatility, the developers evaluated GlycoGenius on three published datasets that span distinct glycan types and instrument configurations. The first was a total plasma N-glycome analyzed by CE-MS after PNGase-F release, sialic acid derivatization, and permanent cationic tagging. The second comprised released O-glycans from keratinocytes, separated by nano-flow LC and detected on an Orbitrap instrument. The third was a collection of urinary glycosaminoglycans from patients with mucopolysaccharidosis, digested with specific lyases, labeled, and measured in negative mode. By replaying data that experts had previously screened by hand, the team could measure exactly how the automated pipeline stacked up against human curation.
Outperforming the Manual Baseline on Plasma N-Glycans
On the plasma N-glycan dataset, the original publication had reported 167 identifications built from 158 unique compositions, with roughly half confirmed by MS2. GlycoGenius, running fully automatically on the same samples, recovered 174 unique N-glycan compositions that all met its quality thresholds—including 115 of the 158 unique compositions originally reported. More strikingly, it proposed 59 additional N-glycan compositions absent from the original study, 46 of which were not documented in the explored literature at all. The automated pass finished in 1 hour and 50 minutes on a modest six-core machine, a timeframe that underscores how much expert time the software returns to the researcher.
The handful of compositions the tool missed turned out to be very low-abundance species whose signals were difficult to call reliably even on manual inspection. In other words, the disagreements between machine and human did not indicate careless automation; they reflected the genuine difficulty of the lowest-intensity peaks, exactly the region where reproducible, threshold-driven scoring adds the most value.
Beyond N-Glycans: O-Glycans and GAGs
The keratinocyte O-glycan set told a similar story. The published analysis had identified 27 unique compositions through a multi-tool chain of feature detection, library matching, and manual peak selection. GlycoGenius confirmed 16 of those at high confidence, detected the remaining 11 (though several fell below its isotopic-fitting quality cutoff, hinting they might be misassigned in the literature), and surfaced 9 novel compositions overlooked by the manual workflow. On the urinary GAG dataset, the program recovered the majority of reported peaks and compositions, flagged several that were absent even in the raw data, and automatically separated sulfation isomers on distinct carbons for specific compositions—an isomer-resolved view that manual review alone struggled to deliver.
Across these classes, the program also handled glycopeptide-level information and supported native spectrum, isotopic-envelope, and chromatogram inspection without forcing users into external software. For laboratories interested in Glycomic Characterization of complex mixtures, that self-contained design removes a major source of friction and error.
A Scoring System Built for Confidence
One of the most consequential design choices in GlycoGenius is how it decides what counts as a real identification. Rather than a composite score whose individual components are poorly defined, the tool leans primarily on an isotopic-envelope fitting score. A value of 0.8 or higher, when paired with an acceptable parts-per-million mass error, is treated as a high-confidence assignment; the threshold is adjustable, but the developers show it is close to optimal. In a merged performance analysis against a manually verified ground truth, an isotopic-fitting cutoff of 0.8 minimized false positives and pushed both specificity and precision to 1.0, while accuracy peaked at the same setting.
When benchmarked head-to-head against GlycReSoft, GlycoGenius achieved a notably higher area under the receiver operating characteristic curve—0.84 versus 0.76—indicating superior discrimination between true glycans and look-alike isobaric noise. Just as important, the automated pipeline completed the O-glycan analysis in about one hour and forty minutes, whereas GlycReSoft required roughly three hours for the core analysis alone, with additional time needed for scripting and data merging. For teams that routinely process many samples, that difference compounds quickly.
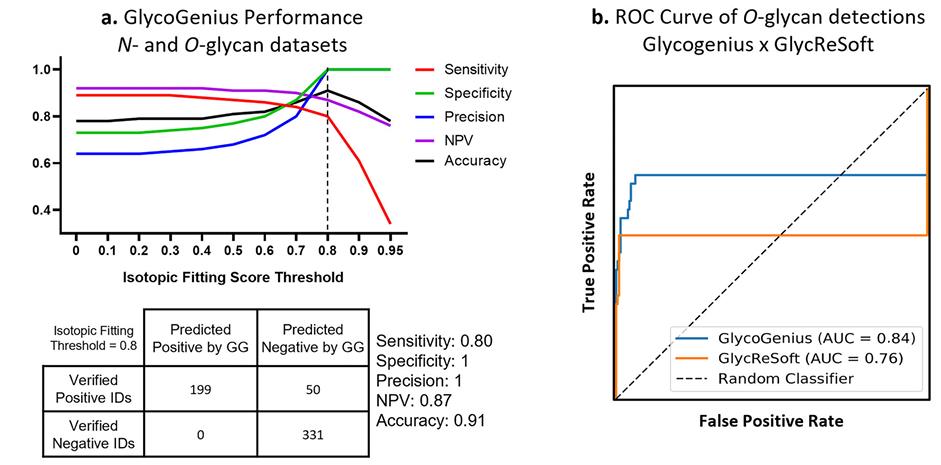
Fig. 2 Benchmarking against a manually verified ground truth shows that GlycoGenius reaches strong identification performance and outperforms GlycReSoft in ROC analysis. (Loponte, et al. 2025)
From Raw Data to Publication-Ready Output
The practical payoff of GlycoGenius is that it compresses an entire analytical journey into one environment. A user imports raw files, builds a compositional library, traces and scores peaks, inspects annotated fragment spectra, and exports human-readable quantitative tables, PDF reports, and high-resolution figures—all without switching programs or writing conversion scripts. The graphical interface lays out the workflow as step-by-step buttons, displays identified compositions in a side panel, and reveals extracted ion traces, peak details, and spectra on demand. Ambiguous masses and MS2-annotated peaks are clearly flagged, which keeps the human reviewer in the loop exactly where judgment matters most.
For applied service providers, the availability of robust upstream methods matters as much as the software itself. Reliable Sialic Acid Derivation, efficient Glycan Release, and Quantitative Monosaccharide Analysis all feed the kind of clean, tagged input that lets an automated pipeline like GlycoGenius perform at its best. The tool is thus as much an enabler of standardized workflows as it is a piece of analysis software.
What This Means for the Field
By delivering end-to-end automation without sacrificing the scrutiny that glycan data demands, GlycoGenius lowers the expertise barrier that has long restricted high-quality glycomics to a handful of specialist labs. It makes large, multi-sample studies tractable, reduces the risk of human misassignment that the authors themselves caught in published datasets, and surfaces previously unreported glycans that may carry biological signal. Coupled with complementary capabilities in Glycoproteomics and Mass Spectrometry–Based Glycan Profiling, the field now has a clearer path from the mass spectrometer to insight.
For CD BioGlyco's clients and the broader glycoscience community, the arrival of a transparent, open-source pipeline reinforces a welcome trend: glycomics is finally catching up to proteomics in automation, letting researchers spend their effort on interpretation and discovery rather than on wrestling with raw spectra.
Related Services & Products
- N-Glycan Profiling
- O-Glycan Profiling
- Glycan Derivation Service
- N-Glycosylation Site Occupation
- Glycoprotein Structure Analysis
- Glycoprotein Quantification
- Glycan Microarray Assay
- Lectin Enrichment
- Cell-surface GAG Glycoengineering Service
- HPLC-CAD-based Oligosaccharides Analysis Service
Reference
- Loponte, H. F., et al. (2025). GlycoGenius: a streamlined high-throughput glycan composition identification tool. Nature Communications, 16, 10335. DOI: 10.1038/s41467-025-65265-2.


